


7
NETWORK PERFORMANCE
MEASUREMENT TASKS
This chapter describes how to perform the following ATM and VLAN
Management network performance measurement tasks.
The following topics are described:
■ Measuring Network -wide ATM Traffic Performance Using the
Bandwidth Icon
■ Measuring Device Level Performance
■ Displaying Port Level Statistics
■ LANE Component Statistics
■ Switch Domain Statistics
Measuring Network
-wide ATM Traffic
Performance Using
the Bandwidth Icon
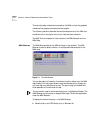
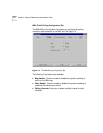
The Bandwidth icon opens the NNIx (Network Node Interface Traffic) Tool
that graphically displays the traffic patterns between ATM switches in the
network. It can be configured to collect, display and store information
about good or bad (error cell) traffic patterns across the network.
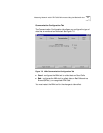
The NNIx Tool can be configured to collect traffic information between
two or more ATM switches. The ATM switches can be selected from a file
browser type selector window called NNIx Browser which lists all the ATM
switches in the network hierarchically based on Enhanced IISP address
structure. Selected ATM switches can be added to the NNIx Map using
the Hide (plus) Button. The Show Subtree (double plus) button can be
used to add the entire ATM switch hierarchy (a root switch and all the
switches below it). Upon adding switches to the NNIx map, the NNIx tool
automatically starts collecting traffic information on the NNI links
between the switches and the in and out traffic of each ATM switch.
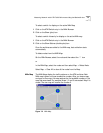
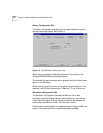
The Configure option under the map menu of the NNIx map can be used
to customize the NNIx tool.