


• Display basic or detailed information for each target vessel
including safety-critical target data.
• Set up a safe zone around your boat.
• View AIS alarm and safety related messages.
Enabling AIS objects
In the chart application:
1. Press the PRESENTATION softkey.
2. Press the CHART LAYERS softkey.
3. Press the CHART LAYERS softkey.
The Chart Layers menu is displayed.
4. Using the trackpad, select the AIS Objects menu item.
5. Press the trackpad right to select the ON option.
6. Press the OK button.
Range rings
Displaying range rings on the chart enables you to measure
distances.
Range rings give you an incremental representation of distance
from your vessel to help you judge distances at a glance. The rings
are always centred on your vessel, and the scale varies to suit your
current zoom setting. Each ring is labelled with the distance from
your vessel.
Enabling range rings
In the chart application:
1. Press the PRESENTATION softkey.
2. Press the CHART LAYERS softkey.
3. Press the CHART LAYERS softkey.
The Chart Layers menu is displayed.
4. Using the trackpad, select the AIS Objects menu item.
5. Press the trackpad right to select the ON option.
6. Press the OK button.
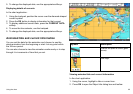
3D chart view locator
You can show a 3D view locator on the 2D chart to indicate the
boundaries of the area currently shown on the 3D chart.
The 3D view locator is a polygon outlined in blue that can be
overlayed on the 2D chart. As you rotate and pitch the vessel
symbol on the display, or use the pan and zoom controls, the blue
polygon moves on the 2D chart to indicate the boundaries of the
area currently shown on the 3D chart.
Enabling the 3D locator
In the chart application:
1. Press the PRESENTATION softkey.
2. Press the CHART LAYERS softkey.
3. Press the CHART LAYERS softkey.
The Chart Layers menu is displayed.
4. Using the trackpad, select the 3D Locator menu item.
5. Press the trackpad right to select the ON option.
6. Press the OK button.
Chart vectors
Chart vectors show additional information on the chart display,
including heading and COG vectors, and wind and tide arrows.
Using the chart
67