


Reference Manual
00809-0100-4530, Rev BA
July 2009
Rosemount 5300 Series
7-10
USING THE ECHO
CURVE ANALYZER
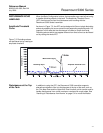
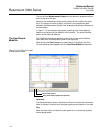
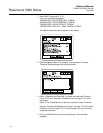
The Echo Curve Analyzer in Rosemount Radar Master (RRM) shows the
measurement signal amplitude from the top to the bottom of the tank. It
includes functions for viewing and recording the Echo Curve, and advanced
functions for configuration of amplitude thresholds
Using the Rosemount
Radar Master
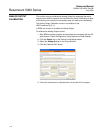
To plot the measurement signal:
1. Start RRM.
2. Open Device Config/Tools (or Device Config/Setup).
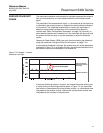
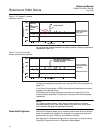
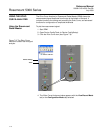
3. Click the Echo Curve icon (see Figure 7-8).
Figure 7-8. The Echo Curve
function is a useful tool for signal
analysis.
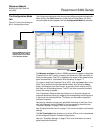
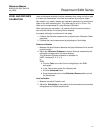
4. The Echo Curve Analyzer window appears with the View/Record Mode
tab (or the Configuration Mode tab) selected.
Tools
Device Config