


Reference Manual
00809-0100-4530, Rev BA
July 2009
7-13
Rosemount 5300 Series
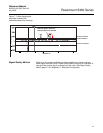
Record Tank Spectra
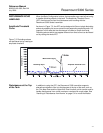
This function allows you to record tank spectra over time. This can be a useful
function if, for example, you want to study the tank signal when filling or
emptying the tank.
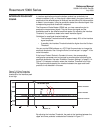
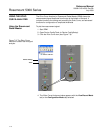
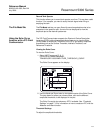
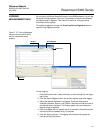
The File ModeTab The File Mode tab lets you open files with saved snapshots/movies to be
presented in the spectrum plot. A movie file can be played to view the
amplitude plot at the desired update rate.
Using the Echo Curve
Analyzer with a 375 Field
Communicator
The 375 Field Communicator supports the Electronic Device Description
Language (EDDL) with enhancements that allows you to view the Echo
Curve, create an Amplitude Threshold Curve (ATC) and specify amplitude
thresholds such as the Surface Threshold, Interface Threshold, and
Reference Threshold.
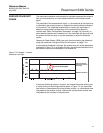
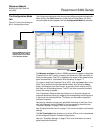
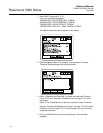
Viewing the Echo Curve
To view the Echo Curve:
1. Select HART command [2, 6, 1].
F
OUNDATION Fieldbus parameter:
TRANSDUCER 1300>AMPLITUDE_THRESHOLD_CURVE
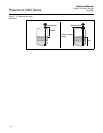
The Echo Curve appears on the display:
2. Use the Hand and Zoom tools to view specific parts of the Echo Curve.
The drop down list allows you choose items, such as the different
amplitude thresholds, to be displayed in the plot.
The Echo Curve plot also shows an ATC if available. See “Threshold
Settings” on page 7-13 for information on how to create an ATC with the
Measure and Learn function.
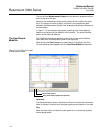
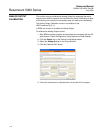
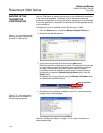
Threshold Settings
To adjust the amplitude thresholds: