


Reference Manual
00809-0100-4530, Rev BA
July 2009
Rosemount 5300 Series
C-20
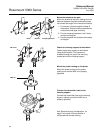
SIGNAL QUALITY
METRICS
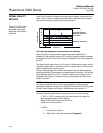
Signal Quality Metrics indicates the surface signal integrity compared to the
noise. It can be used to schedule maintenance to clean the probe or detect
and monitor turbulence, boiling, foam and emulsions.
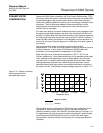
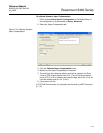
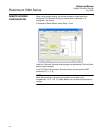
Figure C-17. Echo curve
showing surface peak
amplitude, noise peak
amplitude, and surface
threshold.
The following diagnostics measurements are available:
Signal Quality is a measurement of the surface peak amplitude (P1)
compared to the surface threshold (ATC) and the smallest marginal between
the noise and the ATC above the surface (indicated with a circle) compared to
the ATC.
The Signal Quality spans from 0 to 10, where 0 indicates a low margin, and 10
indicates a high margin. It indicates how much margin there is until the noise
peak is indicated as the surface level.
Surface / Noise Margin is the relationship between surface peak amplitude
and the amplitude of the strongest noise peak above the surface. The Surface
/ Noise Margin spans from 0 to 10, where 0 indicates a low margin, and 10
indicates a high margin. It indicates how much disturbance the device can
handle in the tank.
NOTE!
The signal amplitude and the noise margin depend on probe type and
application conditions, as well as the condition of the probe. Even if the probe
is clean, Signal Quality and Surface / Noise Margin may not be a 10.
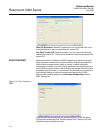
To check if Signal Quality Metrics is supported, do one of the following:
• If “DA1” or “D01” is mentioned in the model code on the label, the
device supports Signal Quality Metrics.
Model Code: 530xxxxxxxxxxxxxxxxDA1 or
530xxxxxxxxxxxxxxxxD01xx
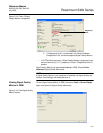
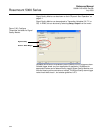
•In RRM:
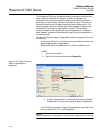
1. Connect to the device.
2. Right click on the device and select Properties.
3.0 4.0
5.0
6.0
P1
Distance, m
Surface Threshold=
Amplitude Threshold
Curve (ATC)
Reference Threshold
Amplitude, mV