


Reference Manual
00809-0100-4530, Rev BA
July 2009
Rosemount 5300 Series
7-12
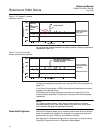
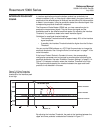
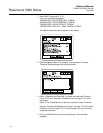
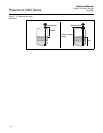
The current level Measurement Output from the device is presented with an
arrow at the top of the plot.
Normally, the measurement output points directly at the surface echo peak,
but if, for instance, the tank is empty, and there is no surface echo peak
detected, the Measurement Output is still presented indicating the distance to
the tank bottom.
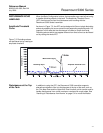
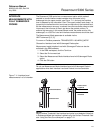
In Figure 7-10, the interface output peak is pointing to the linear distance
based on corrections for the dielectric of the material. The actual interface
peak is at the electrical distance.
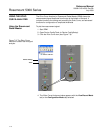
The View/Record
ModeTab
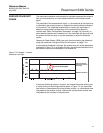
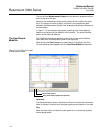
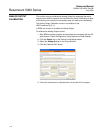
The View/Record Mode tab presents a plot of the current tank conditions.
Each radar echo is displayed as a peak in the signal plot.
When clicking the Echo Curve icon under Device Config/Tools, the Echo
Curve Analyzer window appears with the View/Record Mode tab selected:
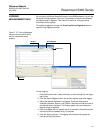
Figure 7-10. An Echo Curve plot
in View/Record mode.
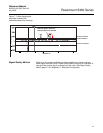
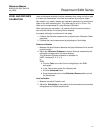
Advanced
The Advanced button opens a list below the Echo Curve plot with information
about all echoes in the tank such as signal amplitude and position in the tank.
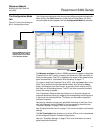
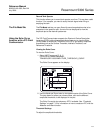
Play
When the Play button is clicked, the tank spectrum is continuously updated
without being stored.
Record tank spectra
Play (continuously updates the spectrum)