


2-11
3 Compare the values found in steps 1 and 2, above. If the first value (A) is less than the second (B),
this shows that power supply specifications are met and power can be supplied to all nodes at any
point in the Network.
Note Be sure to refer to the correct graph as the maximum current flow is different for Thick and Thin
Cables.
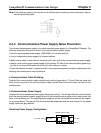
H Countermeasures
If the second value (B) is less than the first (A), use the following procedure to locate the communica-
tions power supply.
• Locate the communications power supply in the center of the Network and the nodes to both sides of it.
• If the nodes are already located at both sides of the power supply, move the power supply in the direc-
tion that requires the larger current capacity.
• If Thin Cable is being used, replace it with Thick Cable.
Note If, after following the above procedure, B is still less than A, go to Step 2 and determine the actual
position of the nodes by the formula calculation method.
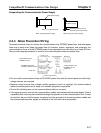
D Calculation Example
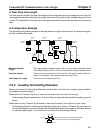
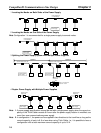
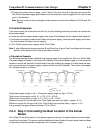
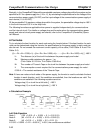
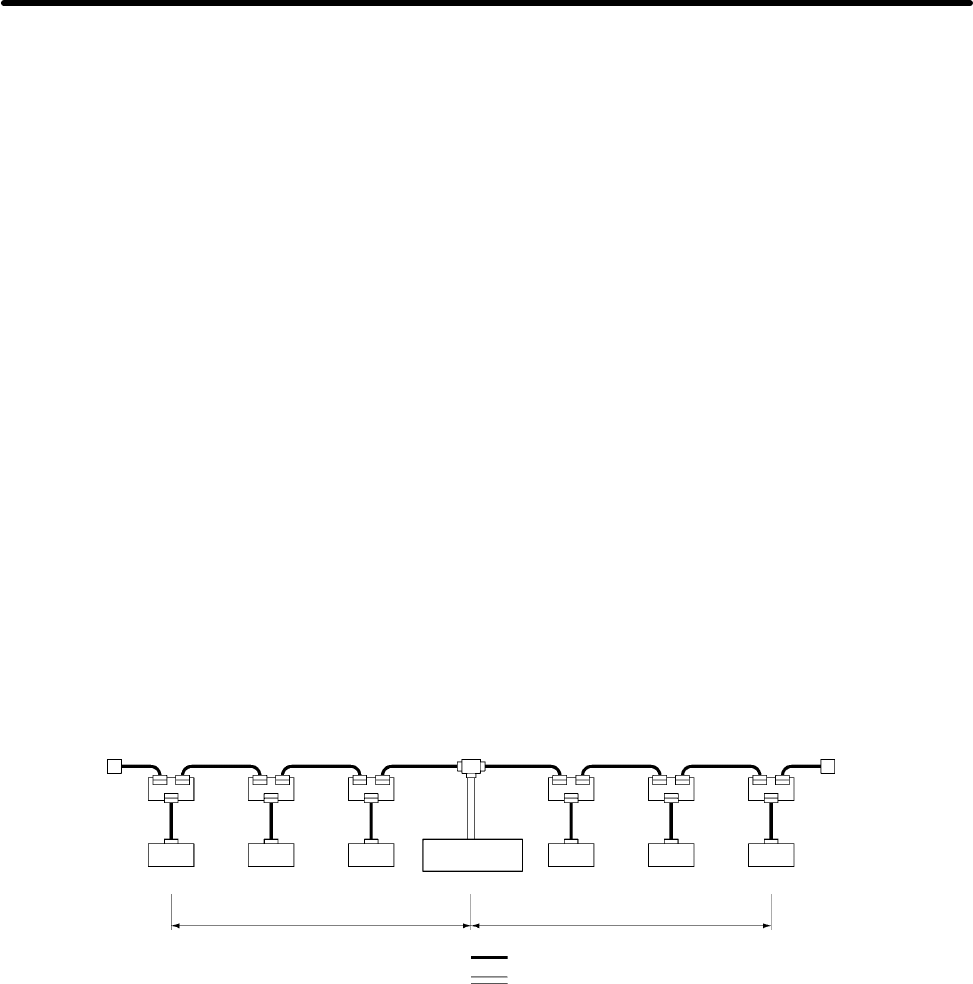
The following example shows a Network that requires power to be supplied for 240 m on Thick Cable.
The power supply is located in the center of the Network. Because the power supply is in the center, the
maximum current will flow both to the left and to the right, enabling the supply of at least twice the maxi-
mum current as when the power supply is placed on the end of the Network. The current consumption
for individual nodes is as follows:
Communications
power supply
120 m
120 m
3 m max.
0.25 A 0.2 A 0.15 A 0.25 A 0.15 A
Node Node Node Node Node
0.1 A
Node
Trunk line
(5-wire cable)
Terminating Resistor
Trunk line
Power supply cable
Terminating Resistor Trunk line
(5-wire cable)
Total power supply length on left = Total power supply length on right = 120 m
Total current consumption on left: 0.1 + 0.25 + 0.2 = 0.55 A
Total current consumption on right: 0.15 + 0.25 + 0.15 = 0.55 A
Maximum current for the left side of the Thick Cable (see previous table) = approx. 2.5 A
Maximum current for the right side of the Thick Cable (see previous table) = approx. 2.5 A
(using straight line approximation between 100 to 150 m)
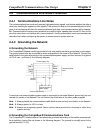
2-3-3 Step 2: Calculating the Best Location of the Actual
Nodes
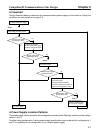
Go to Step 2 if the best location for the power supply according to the specifications cannot be deter-
mined from the graphs. The second method calculates the best location for each actual node and does
not estimate the worst possible configuration for the power supply.
CompoBus/D Communications Line Design Chapter 2