


Embraer Prodigy
®
Flight Deck 100 Pilot’s Guide
190-00728-04 Rev. A
364
HAZARD AVOIDANCE
WEATHER MAPPING AND INTERPRETATION
WEATHER DISPLAY INTERPRETATION
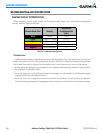
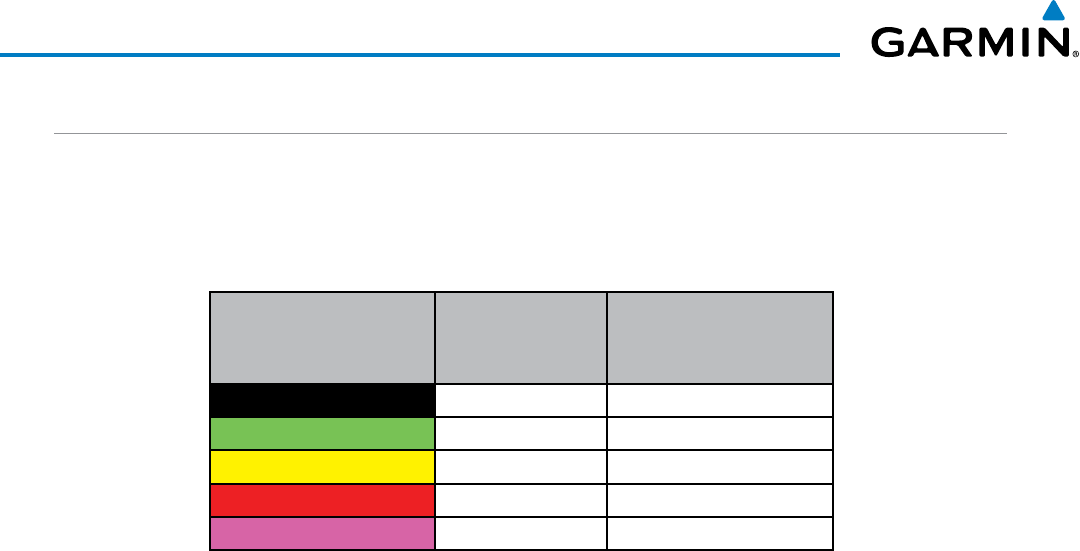
When evaluating various target returns on the weather radar display, the colors denote precipitation
intensity and rates shown in the table.
Weather Mode Color Intensity
Approximate
Precipitation Rate
(in/hr.)
Black < 23 dBZ < .01.
Green 23 dBZ to < 32 dBZ .01 - 0.1.
Yellow 32 dBZ to < 41 dBZ 0.1 - 0.5
Red 41 dBZ to < 50 dBZ 0.5 - 2
Magenta 50 dBZ and greater > 2
Table 6-3 Precipitation Intensity Levels
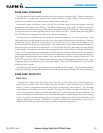
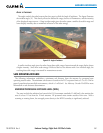
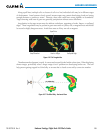
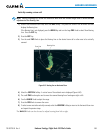
thUnDerstorms
Updraftsanddowndraftsinthunderstormscarrywaterthroughthecloud.Themoreseverethedrafts,the
greaterthenumberandsizeoftheprecipitationdroplets.Withthisinmind,thefollowinginterpretations
canbemadefromwhatisdisplayedontheweatherradar.Avoidtheseareasbyanextrawidemargin.
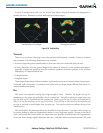
•Inareaswherethedisplayedtargetintensityisredormagenta(indicatinglargeamountsofprecipitation),
the turbulence is considered severe.
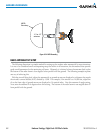
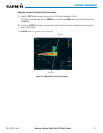
•Areasthatshowsteepcolorgradients(intensecolorchanges)overthinbandsorshortdistancessuggest
irregular rainfall rate and strong turbulence.
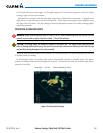
•Areasthatshowredormagentaareassociatedwithhailorturbulence,aswellasheavyprecipitation.
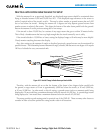
Verticalscanningandantennatiltmanagementmaybenecessarytoidentifyareasofmaximumintensity.