


180 · Raster Chart material
Control of visible chart features
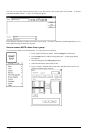
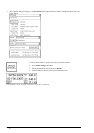
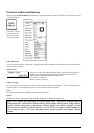
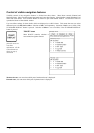
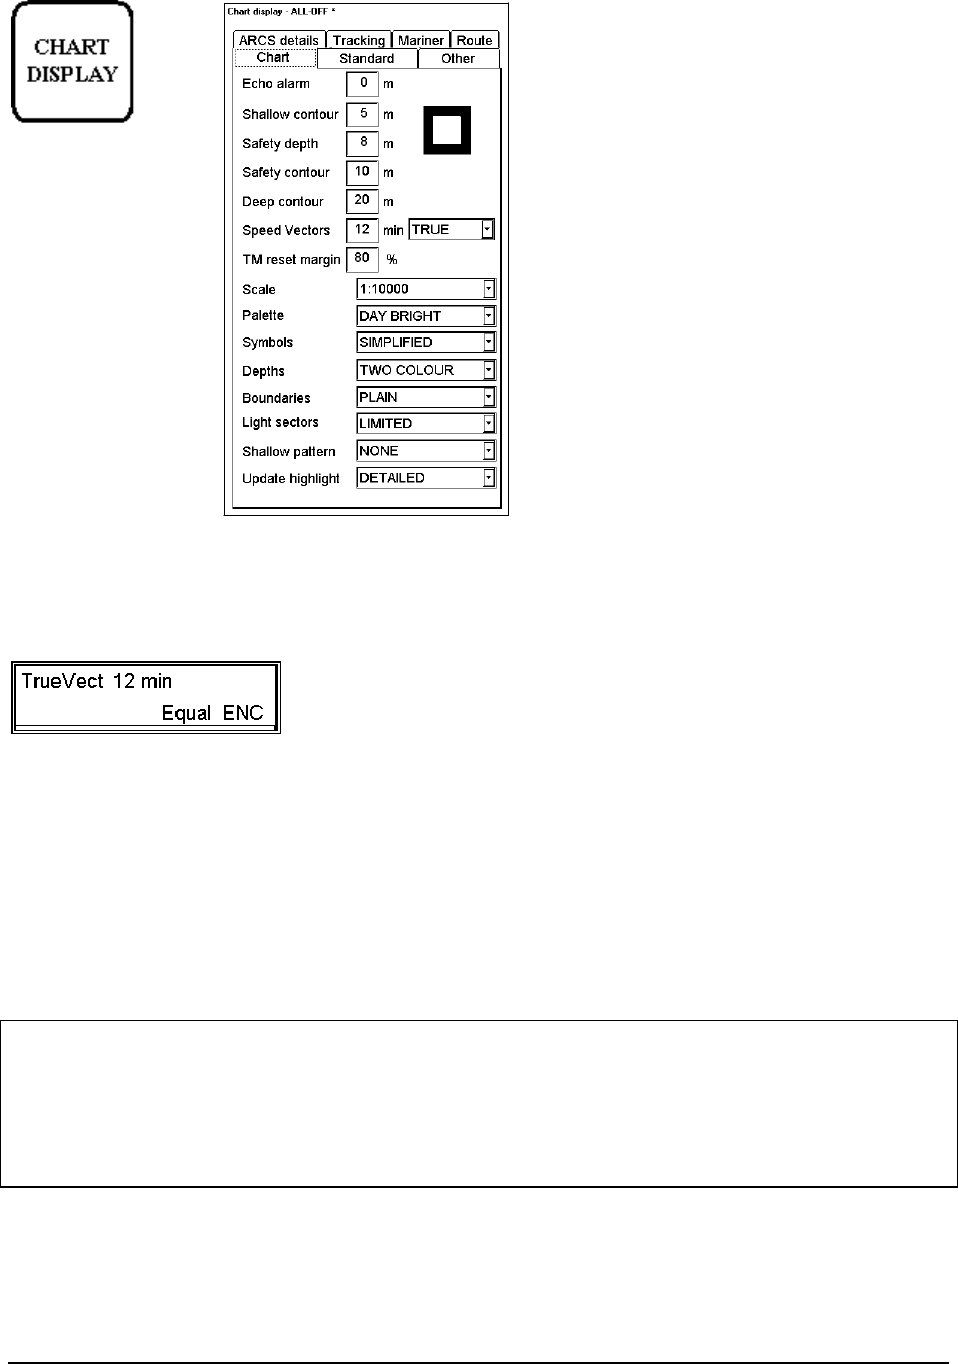
When you press CHART DISPLAY pushbutton, you get Chart details window, which have several sheets to control
visible chart features.
CHART DISPLAY
push button. Dialog
box which appears
after pressing chart
display push button.
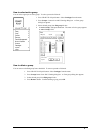
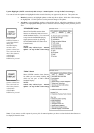
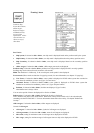
Echo alarm depth:
User can set alarm limit for echosounder. If depth of water below transducer of the Echosounder is below the limit,
an alarm will be generated.
Speed Vectors:
User can set vector time and presentation type for speed vectors displayed on
ECDIS screen. Selected presentation type and length for speed vectors is
indicated Upper right hand corner of ECDIS screen.
True Vectors = TrueVect
Relative Vectors = RelVect
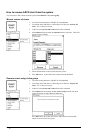
TM reset margin:
In True motion your own ship moves until it reaches the true motion reset borderline. Then it will jump back to
opposite position on screen based on its course. User can set the limit for TM reset.
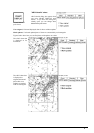
Scale:
This function determines the displayed scale of the electronic chart.
Palette:
Enable user to choose appropriate palette for display depending on brightness of the bridge.
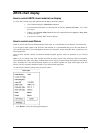
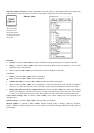
Note! ARCS charts are photocopies of original paper chart. One cannot change image of
these photocopies. Selections of Shallow contour, Safety depth, Safety contour, Deep Contour,
Symbols, Depths, Boundaries, Light sectors, Shallow pattern and Update highlight in Chart
sheet control only visibility of add-on layer(s) on top of ARCS chart image (manual updates are
such an add-on layer). For more information about manual updates, see chapter "Manual
Updates".