


Raster Chart material · 181
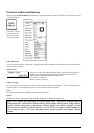
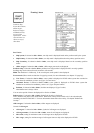
Black and grey colour symbol:
This symbol is used to verify that you can distinguish black (frame of symbol) and grey (inner part of symbol)
colours with current contrast and brilliance settings.
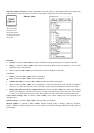
Shallow contour: (NOTE: control only add-on layer - manual update - on top of ARCS chart image )
User can set value of shallow water contour.
Safety depth: (NOTE: control only add-on layer - manual update - on top of ARCS chart image )
User can set the value of safety depth. Spot soundings below the Safety depth are displayed as highlighted.
Safety contour: (NOTE: control only add-on layer - manual update - on top of ARCS chart image )
User can set value of safety contour. Visible safety contour is equal to set value or if the contour of set value is not
available then the visible safety contour is next deeper contour than safety contour.
Note, the system uses Safety contour also for Chart Alarms.
Deep contour: (NOTE: control only add-on layer - manual update - on top of ARCS chart image )
User can set deep water contour.
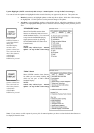
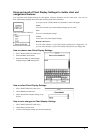
Symbols: (NOTE: control only add-on layer - manual update - on top of ARCS chart image )
Enable user to choose how to display symbols of the chart. The options are:
· Simplified, the shape of symbols is of modern design and the sea mark symbols use colour fill
· Paper Chart, the shape of symbols imitates traditional symbols used in paper charts
Depths: (NOTE: control only add-on layer - manual update - on top of ARCS chart image )
User can set how to display different depth zones on the chart display. If user selects multicolour, the chart display
uses 4 different colours:
· deeper than user-selected deep contour
· between deep contour and user-selected safety contour
· between safety contour and user-selected shallow water contour
· between shallow water contour and coastline.
If user selects two colours, the chart display uses only two colours:
· deeper than safety contour
· shallower than safety contour
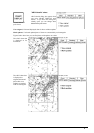
Boundaries: (NOTE: control only add-on layer - manual update - on top of ARCS chart image )
User can set how to display boundaries of some chart features. The options are:
· Plain, the used line styles are limited to plain solid and dashed lines.
· Symbolized, some of the used line styles use symbols to highlight the purpose of a line
Light sector: (NOTE: control only add-on layer - manual update - on top of ARCS chart image )
User can set how to display light sectors. The options are:
· Limited, the length of light sector is fixed at 25 mm independently of the displayed scale.
· Full, the length of light sector represent its nominal range as defined by the chart producer.
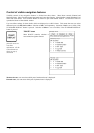
Shallow pattern: (NOTE: control only add-on layer - manual update - on top of ARCS chart image )
User can set how to display shallow water area. The options are:
· None
· Diamond, is provided to distinguish shallow water at night