


User chart control · 263
User chart control
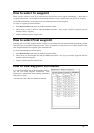
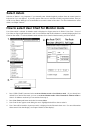
Introduction
User charts are simple overlay charts which the user has made for his own purposes. They can be displayed on both
radar screen and electronic chart on ECDIS display. These charts are intended for highlighting safety related things
like position of important navigation marks, safe area for the ship etc. User Charts areas can be used to activate
alarms and indications based on user defined danger symbols, lines and areas. When route or own ship estimated
position is going to across User Chart symbol, line or area which is defined as a dangerous one, an alarm or
indication is generated by the system. See chapter "Chart Alarm calculation".
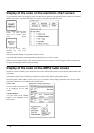
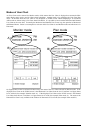
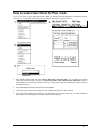
A user chart consists of points, lines and letter/number symbols etc. A user chart contains max. 4000 lines and 2000
symbols (letters and numbers). The user chart is displayed on the radar display and its position and shape is based
on the vessels actual position. When own ship is moving in the area covered by the user chart the elements of the
user chart are superimposed on the radar picture with max 80 nearest elements displayed. The user charts can also
be shown on ECDIS display. In this way the radar display can be kept as ”clean” as possible for radar target
detection.
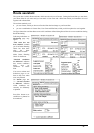
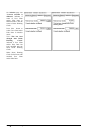
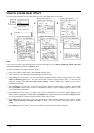
Objects of User Chart
Different symbols and segments used in an User Chart:
· Line; You can define four different type of lines. Lines can be use to Chart Alarm calculation and/or display on
radar:
· Navigation lines: Displayed on both displays (radar + ECDIS). Navigation lines are
reference lines for coast line.
· Coast line: Displayed on ECDIS screen only. Coastal line is usually well defined (by chart
digitizer) multisegment line showing the coast line. User is able to create this type of line in
case of there is no suitable chart available over desired area in ARCS format or in S57 format.
· Depth contour: Displayed on ECDIS screen only. Depth line shows the selected depth
levels. User is able to create this type of line in case of there is no suitable chart available
over desired area in ARCS format or in S57 format.
· Route line: Displayed on both displays (radar + ECDIS). Route lines are zones for anchoring
and traffic separation lines etc.
· Area: User can define closed areas, which the system can use to detect safe water areas. If route or estimated
ship position is going to across the area, system is able to give warning to user. These areas can be used to
specify safe areas as defined by the master or by the policy of the shipowner. They are always available
regardless of the S57 or ARCS chart material used.
· Symbols: User selectable, symbols can be displayed on both displays or on ECDIS display only. Symbols are
used to indicate buoys, light houses, fixed targets, wrecks etc. Symbols can be use to Chart Alarm calculation.
· Tidals: Displayed on ECDIS screen only. Tidals can be used to make own notes about tide at user defined
points.
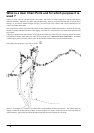
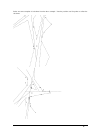
· Points: It doesn't itself have any symbol on radar screen, but it is a very important element of a User chart See
chapter "What is a User Chart Point and for which purpose it is used ?" on page 266.