When designing components it is important to measure group delay so
that you can compensate for any distortion caused by the component.
You may be able to tune the device so as to optimize the performance
of group delay over the frequency range of interest. Outside of the
specified frequency range, the group delay may or may not be linear.
So how is group delay measured? Signals travel too fast to enable
measuring the input and output times of each frequency component.
Consequently, we must use mathematical calculations to derive the
group delay from the phase slope.
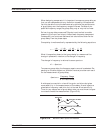
Group delay is mathematically represented by the following equations:
t
q
wp
qq
p
q
=-
-
=
-
=
-
=
d
d
d
df
d
df f
1
2
1
360
1
2
D
D
What this equation shows is that group delay is a measure of the
change in phase with relation to the change in frequency.
The change in frequency is referred to as an aperture.
DfAperture=
To measure group delay the frequency aperture must be selected. De-
pending on the size of aperture, different levels of precision can result
for the measurement of group delay.
Aperture
Frequency Range
Of Data Points
=
#
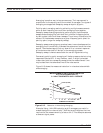
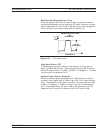
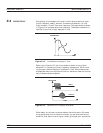
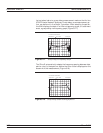
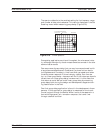
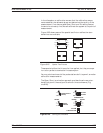
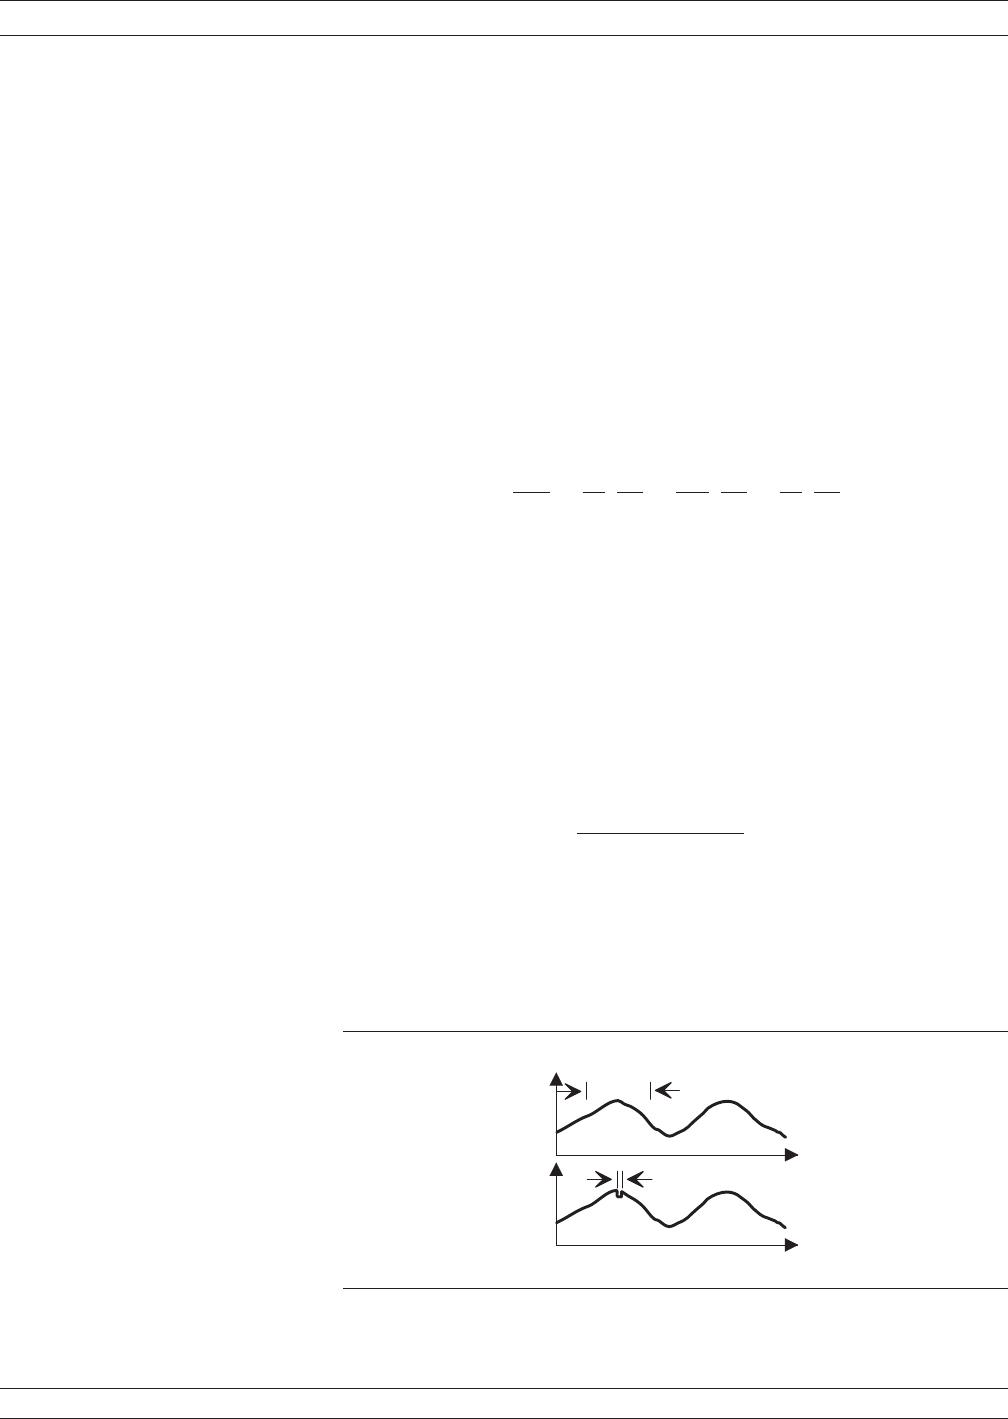
A wide aperture results in a loss of fine-grain variations but gives
more sensitivity in the measurement of time delay. A small aperture
gives better frequency resolution, but at the cost of lost sensitivity.
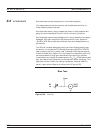
Thus, for any comparison of group delay data you must know the aper
-
ture used to make the measurement (Figure 8-16).
37xxxE OM 8-21
MEASUREMENTS GROUP DELAY
M A G N I T U D E
A P E R T U R E T O O W I D E
A P E R T U R E T O O N A R R O W
F R E Q U E N C Y
Figure 8-16. Waveforms With Aperture Differences


