


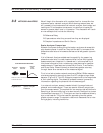
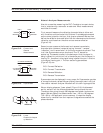
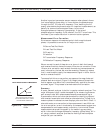

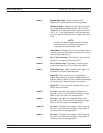
There are several ways in which all the information can be displayed
on one trace. One method is a polar display (Figure 3-17). The radial
parameter (distance from the center) is magnitude. The rotation
around the circle is phase. We sometimes use polar displays to view
transmission measurements, especially on cascaded devices (devices in
series). The transmission result is the addition of the phase and log
magnitude (dB) information of each device’s polar display.
As we have discussed, the signal reflected from a DUT has both mag
-
nitude and phase. This is because the impedance of the device has
both a resistive and a reactive term of the form r+jx. We refer to the r
as the real or resistive term, while we call x the imaginary or reactive
term. The j, which we sometimes denote as i, is an imaginary number.
It is the square root of –1. If x is positive, the impedance is inductive; if
x is negative, the impedance is capacitive.
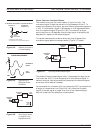
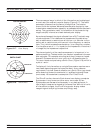
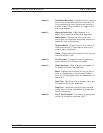
The size and polarity of the reactive component x is important in im
-
pedance matching. The best match to a complex impedance is the com
-
plex conjugate. This complex-sounding term simply means an imped-
ance with the same value of r and x, but with x of opposite polarity.
This term is best analyzed using a Smith Chart (Figure 3-18), which is
a plot of r and x.
To display all the information on a single S-parameter requires one or
two traces, depending upon the format we want. A very common
requirement is to view forward reflection on a Smith Chart (one trace)
while observing forward transmission in Log Magnitude and Phase
(two traces). Let us see how to accomplish this in the 37xxxE.
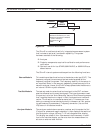
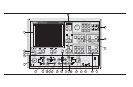
The 37xxxE has four channels. Each channel can display a complete
S-parameter in any format on either one or two traces. All four
S-parameters can be seen simultaneously in any desired format. A
total of eight traces can be viewed at the same time. While this is a lot
of information to digest, the 37xxxE’s large color display makes
recognizing and analyzing the data surprisingly easy.
NETWORK ANALYZERS NETWORK ANALYZERS, A PRIMER
3-10 37xxxE OM
-90
180
90
0
POLAR DISPLAY
Figure 3-17. Polar Display
50
INDUCTIVE
CAPACITIVE
SMITH CHART
Figure 3-18. Smith Chart