


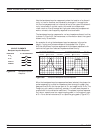


The lowpass impulse response displays the location of discontinuities
as well as information useful in determining the impedance (R, L, or
C) of each discontinuity.
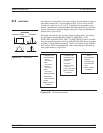
The impulse response is a peak that goes positive for R>Z
0
and nega
-
tive for R<Z
0
. The height of the response is equal to the reflection coef
-
ficient:
r=
-
+
RZ
RZ
0
0
The impulse response for a shunt capacitance is a negative-then-
positive peak and for a series inductance is a positive-then-negative
peak (Figure 9-1).
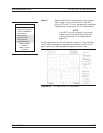
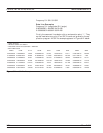
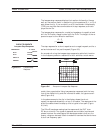
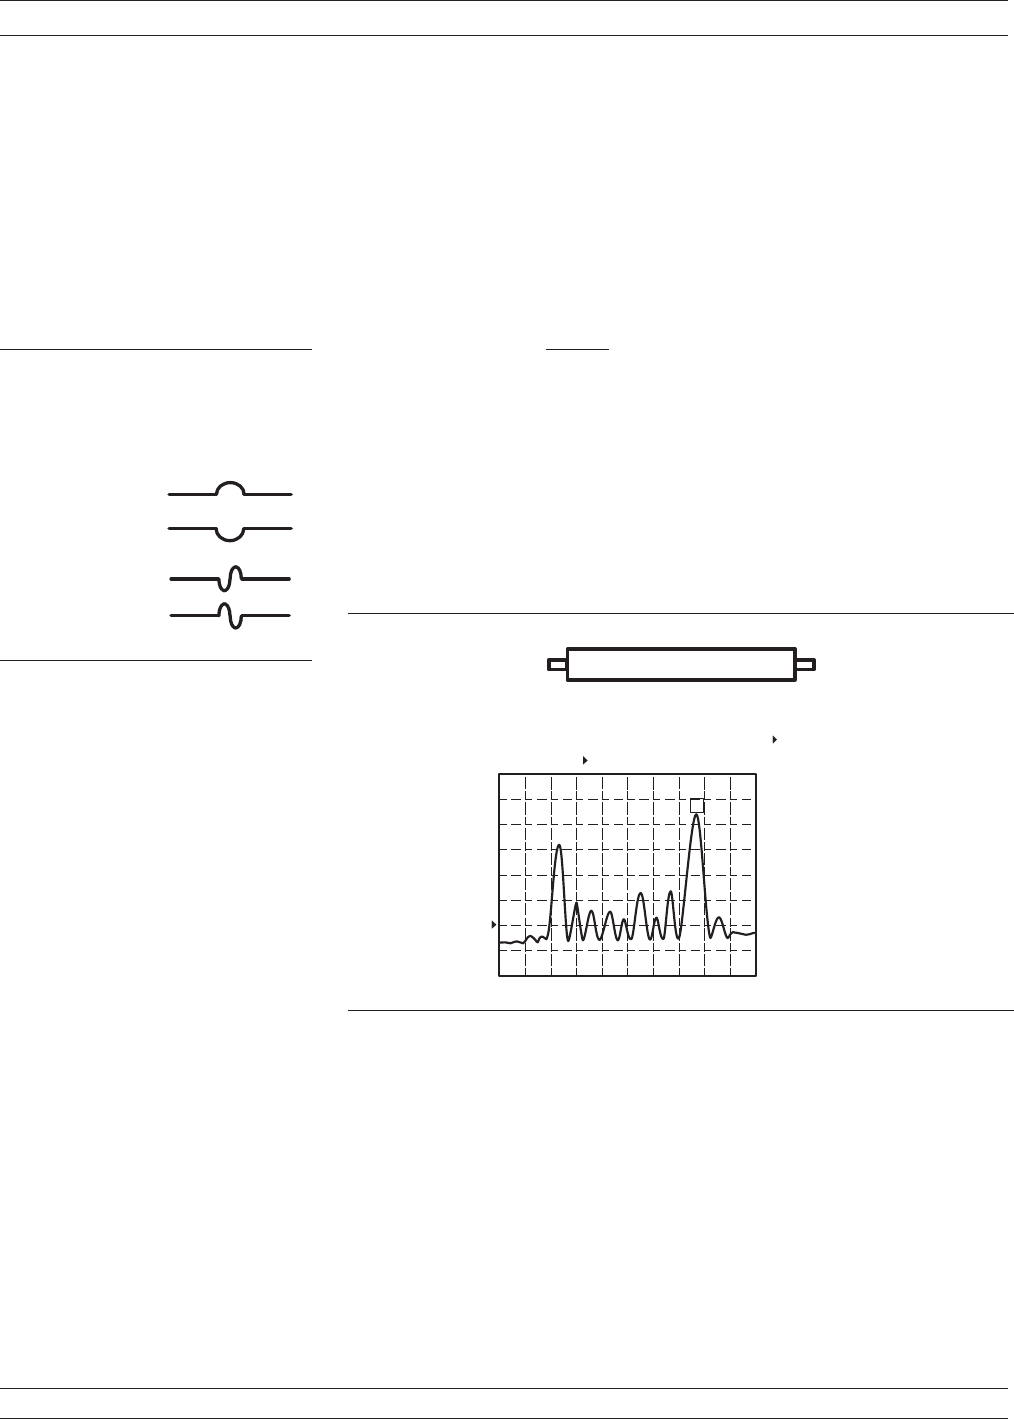
An example of using an impulse response is a circuit impedance analy
-
sis. With an impulse response we can observe the circuit response of a
passive device, such as a multi-element step attenuator (Figure 9-2),
and make final, realtime adjustments during the test.
In the above example, the connectors at each end have been gated out
(page 9-12), which lets you better observe the internal circuit response.
Each displayed marker has been manually set to the peak of the re
-
sponse at each adjustable circuit element. In this way, the data display
lets you make the adjustment in realtime, while the marker menu
shows the magnitude of the response at each marker.
TIME DOMAIN MEASUREMENTS TIME DOMAIN
9-4 37xxxE OM
C I R C U I T E L E M E N T S
R > Z
O
S H U N T C
S E R I E S L
I M P E D A N C E
O
R < Z
L o w p a s s I m p u l s e R e s p o n s e
1 1
S R E A L
Figure 9-1. Lowpass Impulse
Response
0 . 0 0 0 p s
7 0 0 .0 0 0 p s
S 1 1 F O R W A R D R E F L E C T IO N
L I N E A R M A G .
R E F = 5 .0 0 0 m U
7 . 0 0 0 m U /D IV
L P w / G
6 1 5 2 . 5 1 4 p s
2 7 .5 3 4 m U
2 4 6 5 . 3 6 3 p s
1 5 .6 2 4 m U
3 3 7 5 . 4 1 9 p s
1 5 .0 2 0 m U
4 2 9 3 . 2 9 6 p s
9 .5 9 3 m U
5 1 9 5 . 5 3 1 p s
1 1 .6 2 4 m U
M A R K E R T O M A X
M A R K E R T O M I N
M A R K E R 1
5 1 2 .2 9 1 p s
3 6 .8 9 0 m U
C H 1 - S 1 1
0 0 .0 0 0 p s d iy
S T E P A T T E N U A T O R
1
4
6
2
3
5
Figure 9-2. Example of Lowpass Impulse Response