


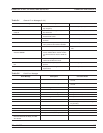
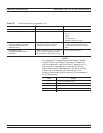


Graph Data Types The data types (real, imaginary, magnitude, phase) used in the dis
-
played graph-types reflect the possible ways in which S-Parameter
data can be represented in polar, Smith, or rectilinear graphs. For ex
-
ample: Complex data—that is, data in which both phase and magni
-
tude are graphed—may be represented and displayed in any of the
ways described below:
q
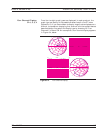
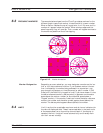
Complex Impedance—displayed on a Smith chart graph
q
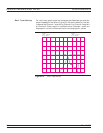
Real and imaginary—displayed on a real and imaginary graph
q
Phase and magnitude components—displayed on a rectilinear
(Cartesian) or polar graph
q
Group delay plot—group-delay measurement units are time,
those of the associated aperture are frequency and SWR
The quantity group delay is displayed using a modified rectilin
-
ear-magnitude format. In this format the vertical scale is in linear
units of time (ps-ns-ms). With one exception, the reference value and
reference line functions operate the same as they do with a normal
magnitude display. The exception is that they appear in units of time
instead of magnitude.
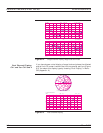
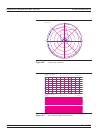
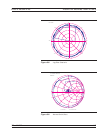
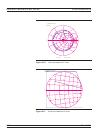
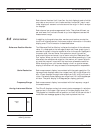
Examples of graph-data types are shown in Figure 6-6 through 6-11,
on the following pages.
37xxxE OM 6-7
DATA DISPLAYS DISPLAY MODES AND TYPES